Difference between revisions of "Statistics Bar Guide"
(related links) |
|||
| Line 1: | Line 1: | ||
{{Help|LandSim=*|Viewer=*}}{{RightToc}} | {{Help|LandSim=*|Viewer=*}}{{RightToc}} | ||
[[File:V1.23 Statistics Bar Small.jpg|thumb|250px|left]] | [[File:V1.23 Statistics Bar Small.jpg|thumb|250px|left]] | ||
| Line 148: | Line 147: | ||
'''Spare Time ''' - The amount of time at the end of executing a single frame. This is the best indication of load if the region is running at 45fps. A larger number here is better - it indicates headroom for more work that can be done before the region frame rate would drop. | '''Spare Time ''' - The amount of time at the end of executing a single frame. This is the best indication of load if the region is running at 45fps. A larger number here is better - it indicates headroom for more work that can be done before the region frame rate would drop. | ||
== Related Links == | |||
*{{slkb|4417|counterpart to this article}} | |||
*[[User's Manual]] | |||
*[[Region Performance Improvement Guide]] | |||
Revision as of 08:44, 19 August 2009
| Help Portal: |
Avatar | Bug Fixes | Communication | Community | Glossary | Land & Sim | Multimedia | Navigation | Object | Video Tutorials | Viewer | Wiki | Misc |
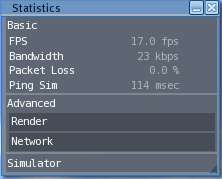
The "Statistics" floating window presents detailed information about the performance of the Second Life Viewer software running on your computer, your Internet connection, and the "Simulator" program running on the host server. The Simulator is what keeps track of everything going on in one map Region. It sends data to all the users who have an avatar in or can see that region, which your Viewer then displays. It also receives any updates as you move, create objects, etc.
A good Second Life session requires all three parts (Viewer, Internet, and Simulator) to be working well, and this window helps to see what is going on in detail, and where the problem may lie if there is one. While the sheer amount of information can be confusing, knowing what to look for can tell you a lot about what's going on in Second Life.
Like most floating windows, this one is off by default. Select View > Statistics Bar from the menu bar on the top left side of the Second Life window to turn it on. Most of the items in the window can be expanded or contracted by clicking on them.
The following sections will describe the individual items
'Basic' Panel
FPS - Short for 'Frames per Second'. Your graphics card or chip continually re-draws the 3D view area in real time. This number tracks how many times per second it is happening. It is affected by the basic capacity of your computer components, what other programs you may have running, the graphics setting you are using, and how complicated the 3D scene is. 30 FPS would be equivalent to live television, but rates of 10-15 are useable for many activities. For still photography a low rate is acceptable, while recording 'machinima' (a video using SL avatars as actors), or combat roleplays a higher rate is desired.
Bandwidth - How much data is being transferred between your computer and the Second Life server in kilobits per second (kbps). This number varies wildly depending on what bandwidth settings you've used, where you are inworld, what's going on, and whether you're still loading some things (objects/textures/etc) that are in your field of view. If bandwidth remains 0kbps, it is likely your internet connection has dropped or the server is down. Second Life will automatically log you out after a period of no communication.
Packet Loss - Data on the internet is sent in small 'packets'. They are similar to postcards, with a destination address and the actual message contents. Data packets travel both ways continuously when you are logged in. This item measures how many packets are lost as a percentage. It normally should be 0.0%. Anything above that indicates a problem.
Packet loss can be caused by an overloaded server, a bad Internet connection (possibly a bad router between your ISP and Second Life, or congestion at your ISP), or problems on your local network (wireless networking, or internet security or firewall software on your computer). It can also be caused by your network Edit > Preferences > Network speed set too high for your computer. While your internet connection may be fast, your computer actually has to do something with the data as it comes in. If it comes in too fast, packets may be 'dropped' at your end.
Ping Sim - Travel time for data from your computer to the server in milliseconds (msec). For a good session, values of 200msec or less would be desired (1/5 of a second). This is about the human reaction time, so higher values produce noticeable lag.
'Advanced' Panel
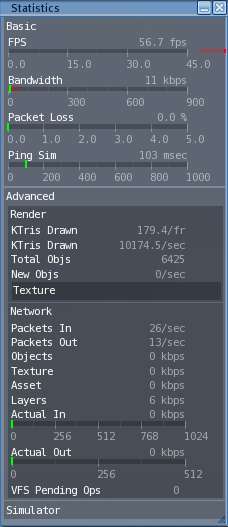
When expanded shows more details on rendering and network performance.
* Render Section:
Data about the objects, avatars, and how they are arranged in 3D are sent to your computer in pieces. Your graphics card or chip then assembles these pieces into the view on your screen.
KTris Drawn - (per frame) Computer-generated 3D objects are built out of triangles (the basic geometric shape). This item shows thousands of triangles (KTris) per frame and per second.
Total Objs - The number of objects currently in view, which includes:
Prims - primitive shapes such as cubes and cylinders, the basic shapes objects in Second life are built from. Complex objects are made by linking together prims
Avatars - This includes the basic body shape, and any attachments the avatar may be carrying
Terrain patches - The ground is made up of units 4x4 meters in size which are modified by a shape
Trees - "Linden Trees" are counted as one object on the simulator, but are stored in detail on your computer
Particle groups - Particles are free-moving temporary objects
Water patches - Water is also made up of units 4x4 meters in size.
New Objs - The number of objects being downloaded per second.
Texture - Textures are images applied to the surface of objects to make them look like something. Objects with no downloaded texture are shown as grey. The default texture for new objects is plywood.
Count - The number of unique textures loaded by the viewer.
Raw Count - The number of textures loaded by the viewer that have been paged out (exist in application memory and not driver memory).
GL Mem - The amount of graphics card memory consumed by textures.
Formatted Mem: -
Raw Mem - The amount of application memory consumed by textures.
Bound Mem - The memory size of all textures bound for rendering per frame.
* Network Section:
Packets In - Number of data packets per second arriving
Packets Out - Number of data packets per second being sent
Objects - Data about objects in kbps
Texture - Data about textures in kbps
Asset - Assets are all the individual items which are stored in your inventory, or in the Second Life database. They include such things as textures, objects, notecards, sound clips, etc. Each has a unique 128 bit identifying number (UUID).
Layers -
Actual In - Amount of data coming in (kbps)
Actual Out - Amount of data being sent (kbps)
VFS Pending Ops -
'Simulator' Panel
Displays detailed statistics for the copy of the Simulator program running the map region you're avatar is currently in.
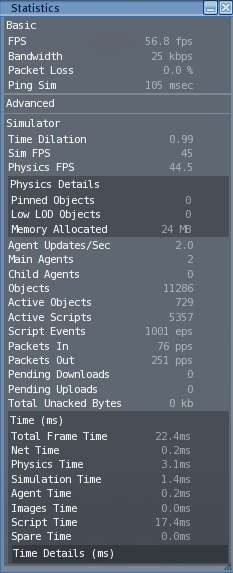
Time Dilation - The physics simulation rate relative to realtime. 1.0 means that the simulator is running at full speed; 0.5 means that physics are running at half-speed. Normal operation should be at or close to 1.0. Lower values mean the server has too much work to do, and has to slow down. This is a form of lag when you experience it. It can be caused by any combination of too many people, active objects, or scripts trying to do too many things or causing too much communication by the server.
Sim FPS - The simulator updates the region data in time increments called 'frames', and then sends any required changes or downloads to all the avatars that need it. This shows the updates in frames per second (fps). The maximum rate is set at 45 fps, so if the simulator is not overloaded it should read that value.
Physics FPS - The physics portion of the simulator keeps track of moving objects and their collisions with each other, the ground, etc. This shows the frame rate per second (fps) The maximum rate is set at 45 fps, so if the simulator is not overloaded it should read that value.
*Physics Details Panel:
Some of the statistics in the Simulator section relate to the Physics engine and are new with Havok4 and the 1.20 version of the viewer. These are explained in detail at Simulator Physics Statistics
Agent Updates/Sec: - Agents are the data representing a user - how the avatar looks, where it is, and what it is doing. The rate at which agents on this simulator are being updated. Normally 20 updates a second, this will decrease if the simulator has a large number of agents on it.
Main Agents - The number of agents (users) who are in this map region.
Child Agents - The number of agents who are not in this map region, but can see it. To create the illusion of a continuous 3D environment, they need to receive data for any map region in their field of view.
Objects - The total number of detached primitive shapes in this map region. This value does not include primitives being worn as attachments. Most map regions have a limit of 15,000 objects (full regions). Homesteads have a limit of 3750, and Openspaces have a limit of 750. These limits are enforced regardless of how ownership of the map region is divided
Active Objects - The number of objects containing active software scripts in the map region. This value does not include scripts inside attachments, unless the attachment wearer is sitting on a scripted object.
Active Scripts - The number of running scripts that are currently on the simulator, including scripts attached to agents and objects. It is not the same as the number of active objects because objects can contain multiple scripts.
Script Events - Number of LSL opcodes being executed a second by the simulator. Note that this is the number of ACTUAL instructions executed in the last second, not the theoretical maximum opcodes/second. If your simulator is not running very many scripts, this number will be low even if performance is good.
Packets In - Total number of data packets being received by the simulator program. Not the same as Packets In above, which only measures the number from you.
Packets Out - Total number of data packets being sent by the simulator program.
Pending Downloads - Number of asset downloads to the simulator that are pending. If this is greater than 1, this means that you may see delays in viewing notecards or scripts, and rezzing objects.
Pending Uploads - Number of current uploads of asset data pending. If this number is non-zero, this means that there may be performance issues when attempting to teleport.
Total Unacked Bytes – The size of the packet data sitting on the server waiting to be acknowledged (signaled as recieved) by the viewer program. This is the 'not done downloading queue'. It is not considered done until it is known to have been received. This will normally jump when you first arrive in a new area, or new avatars arrive. Persistent values above a few kilobytes (kb) indicates a communications problem.
*Time (ms) Panel:
The simulator program performs various activities within each frame it processes. This panel shows how much time is devoted to each
Total Frame Time – The sum of all time values listed below it, this measures how much time it takes the simulator to run everything that the simulator is trying to do each frame. This includes some time at the end of the frame where the simulator is idle, alternating between sleeping and handling some network traffic.
- o approx. 22 ms - The simulator is healthy, running at full speed. This number should not go less than 22ms, as the simulator frame rate is capped at 45fps.
- o > 22 ms - The simulator is experiencing severe load, either due to physics or a large number of agents, such that even by slowing down script execution it is impossible to compensate. The simulator frame rate has been reduced as a result.
Net Time - The amount of time spent responding to incoming network data.
Physics Time - The amount of time that frame spent running physics simulations. In general, this should be less than 5 milliseconds.
Simulation Time - The amount of time that frame spent running other simulations (agent movement, weather simulation, etc.)
Agent Time - The amount of time spent updating and transmitting object data to the agents.
Images Time - The amount of time spent updating and transmitting image data to the agents.
Script Time - The amount of time spent running user provided software scripts.
Spare Time - The amount of time at the end of executing a single frame. This is the best indication of load if the region is running at 45fps. A larger number here is better - it indicates headroom for more work that can be done before the region frame rate would drop.


