Difference between revisions of "File:FATS graph.png"
Jump to navigation
Jump to search
Oskar Linden (talk | contribs) (Analysis of download queues before and after updating the simulators with the FATS code. The plot shows the number of regions experiencing longish (>10, >20) download queues over a sample period. FATS deployed in week 17 and dropped the numbers significa) |
(No difference)
|
Latest revision as of 14:53, 12 May 2011
Analysis of download queues before and after updating the simulators with the FATS code. The plot shows the number of regions experiencing longish (>10, >20) download queues over a sample period. FATS deployed in week 17 and dropped the numbers significantly. In fact, the maximum values seen since deployment are less than half the average values over the past year.
File history
Click on a date/time to view the file as it appeared at that time.
| Date/Time | Thumbnail | Dimensions | User | Comment | |
|---|---|---|---|---|---|
| current | 14:53, 12 May 2011 | 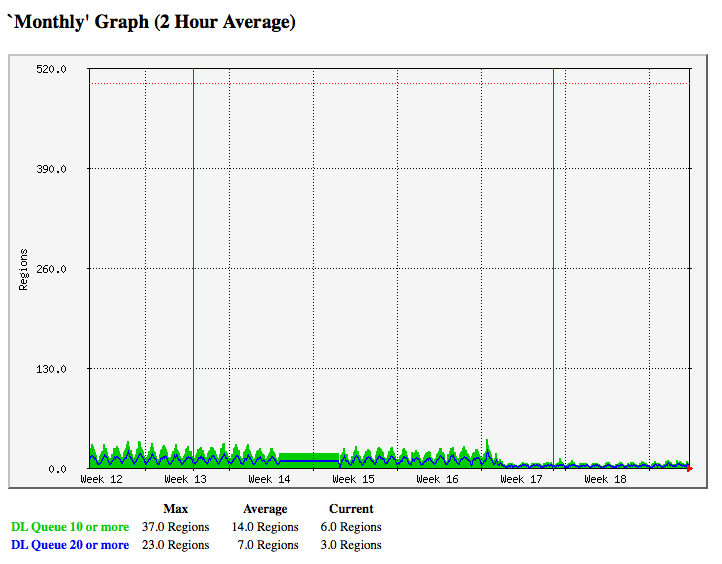 | 722 × 564 (45 KB) | Oskar Linden (talk | contribs) | Analysis of download queues before and after updating the simulators with the FATS code. The plot shows the number of regions experiencing longish (>10, >20) download queues over a sample period. FATS deployed in week 17 and dropped the numbers significa |
You cannot overwrite this file.
File usage
There are no pages that use this file.