Difference between revisions of "LLMessageSystem Burst Metrics"
Poppy Linden (talk | contribs) |
Poppy Linden (talk | contribs) |
||
| Line 66: | Line 66: | ||
== Examples == | == Examples == | ||
This is an example from an artificially-busy development LLApp I've been working on, so the numbers look ''really huge'' but that's, unfortunately, not real. | |||
<code> | <code> | ||
2010-02-09T04:48:47Z INFO: log: LLLOGMESSAGE (1) logMessageBurstStats {'avg_message_burst_throughput_rate':r1768.89, 'data_points':i702, 'frame_time_dur':r53.1146, 'max_message_break_duration':r5.85154, 'max_message_burst_count':i227, 'max_message_burst_duration':r0.307471, 'max_message_burst_throughput_rate':r12422.4, 'min_message_burst_throughput_rate':r163.62, 'mode':'worker', 'total_message_break_duration':r47.1424, 'total_message_burst_duration':r6.48097, 'total_message_count':i6341, 'total_message_throughput_rate':r119.383} | 2010-02-09T04:48:47Z INFO: log: LLLOGMESSAGE (1) logMessageBurstStats {'avg_message_burst_throughput_rate':r1768.89, 'data_points':i702, 'frame_time_dur':r53.1146, 'max_message_break_duration':r5.85154, 'max_message_burst_count':i227, 'max_message_burst_duration':r0.307471, 'max_message_burst_throughput_rate':r12422.4, 'min_message_burst_throughput_rate':r163.62, 'mode':'worker', 'total_message_break_duration':r47.1424, 'total_message_burst_duration':r6.48097, 'total_message_count':i6341, 'total_message_throughput_rate':r119.383} | ||
</code> | |||
<code> | |||
2010-02-09T04:48:57Z INFO: log: LLLOGMESSAGE (2) logMessageBurstStats {'avg_message_burst_throughput_rate':r1097.77, 'data_points':i115, 'frame_time_dur':r10.1428, 'max_message_break_duration':r2.9249, 'max_message_burst_count':i216, 'max_message_burst_duration':r0.314165, 'max_message_burst_throughput_rate':r3458.5, 'min_message_burst_throughput_rate':r438.102, 'mode':'worker', 'total_message_break_duration':r9.07722, 'total_message_burst_duration':r1.16166, 'total_message_count':i1082, 'total_message_throughput_rate':r106.676} | |||
</code> | </code> | ||
Revision as of 17:59, 9 February 2010
Why care about message processing?
The dataserver receives a message, makes a database query or two, then sends a response. The next message isn't received until the response is sent. LLMessageSystem in other LLApp instances is used in a similar way - receive message, do processing, receive next message. The question becomes, what is the longest amount of time that a message has to wait to be processed? In many instances, this wait manifests itself as "lag", and in the worst cases can result in timeouts and failed operations.
What do we want to know about messages?
There are several concerns. Among the reasons this metric was added:
- How much longer is response time when database network latency is increased? (dataserver specific)
- What is gridwide message response time? For which application?
Ideally, we would like to be able to make a list of information about each message:
- time received
- time processing started
- time processing finished
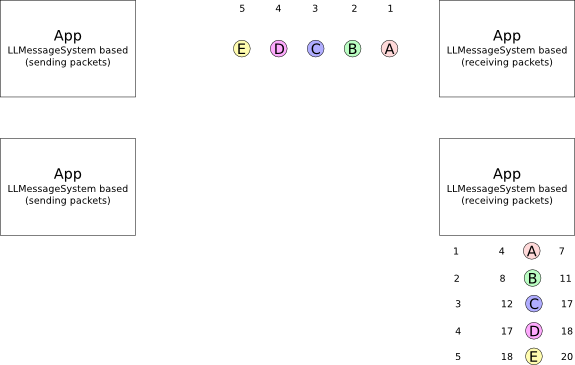
In the case of the dataserver, over a specified time period the maximum time processing finished minus time received would be the worst case of message latency on that app. Think about this instance:
Message E has the highest response latency - it wasn't done processing until 15ms after it was received.
The way the world actually works
Unfortunately, with the way the message system currently works, there is no way to tell when a message was received. Worse, the packet buffer is extremely small and there is no way to tell if a message is dropped. Let's run through the above example in a more realistic environment.
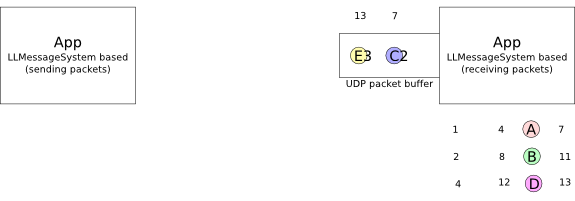
Message A, B, C received in the same order, but C doesn't fit in the buffer, so is silently dropped. In this case we're assuming the sender will re-send after a certain time if an ACK isn't sent back. For the sake of the example, assume an ACK is sent right when a message begins processing, and resends are at 4ms. (it's more complicated than this, but this example is far more convoluted than the previous one already.)
Time 4 comes around, A is pulled out of the buffer for processing, B moves forward in the incoming queue, and D is received. E is dropped, because by the time 5ms rolls around, the buffer is full again. B is resent because it hasn't been ACK'd by 6ms - A is still processing until 7ms. The resend of B happens to a full buffer, and is dropped.
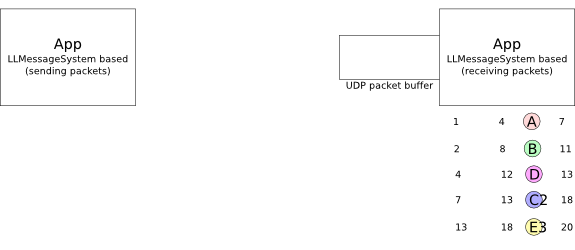
At the tick of 8ms message B is pulled in for processing, and the resend of C hits the buffer. Before B is done processing, E gets resent, but dropped again.
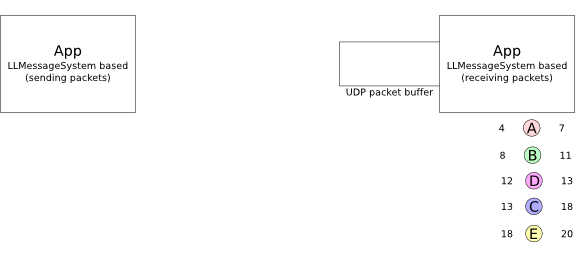
By the time D gets pulled in, the third E comes around and makes it to the buffer. There are no more new packets in the rest of the timeframe we're looking at, so we can see what times all of these packets came in and out.
Looks a little different than the ideal example, but the sum of the processing times remains the same. The receiving application was constantly busy in either case. The worst case wait is still message E and is also matched by C - 15ms (20 - 5, and 18 - 3, respectively).
The end result is the same as if all of the messages had arrived at once. And we've got a little bit more information in the diagrams than there is in the system itself - remember, there's no way to tell what the actual arrival times are. Hence, from the system, we can't tell the difference between this case and the previous case.
This is all the information we have - we may know a message is a resend, but we don't know when the original was intended to be received.
The Burst, defined
This brings us to the concept of the message burst. If we started processing messages at 4ms, and stopped at 20ms, we know that the theoretical worst case would be if all the messages arrived simultaneously the last message would be waiting 16ms for a reply. That's worse than the truth, but it's the closest thing we have. There's also another approximation - that we're always processing messages, and they don't have to wait long to start processing (clearly not the case for packet A).
A burst is this constant arrival of packets. It ends when the buffer is found to be empty. Second Life backend traffic tends to be very bursty with long break periods. Unfortunately, these bursts can last many full seconds, causing terrible lag. This metric, combined with the many others that we already have, should give us a better idea about what our current message latency is today, and if changes we make help or hurt it. It's just one part of the connection, but hopefully it helps.
Implementation details
- Burst metrics are disabled by default, because timer calls can be expensive - 12ns * 4 may be significant if you are expecting to process several messages per 1ms!
- The bursts are recorded as matching lists of the duration of the burst and the count of messages in the burst.
- The metrics are available both as calculated statistics, and raw data (if you have need of more accurate stats)
- If burst tracking is enabled, but you want to dynamically suppress either log output, you need merely add a "log-messages" section to you app's LiveConfig file, add a key for the log message ("logMessageBurstStats" and "logMessageBurstData", respectively) and set "use-syslog" to integer 0.
Examples
This is an example from an artificially-busy development LLApp I've been working on, so the numbers look really huge but that's, unfortunately, not real.
2010-02-09T04:48:47Z INFO: log: LLLOGMESSAGE (1) logMessageBurstStats {'avg_message_burst_throughput_rate':r1768.89, 'data_points':i702, 'frame_time_dur':r53.1146, 'max_message_break_duration':r5.85154, 'max_message_burst_count':i227, 'max_message_burst_duration':r0.307471, 'max_message_burst_throughput_rate':r12422.4, 'min_message_burst_throughput_rate':r163.62, 'mode':'worker', 'total_message_break_duration':r47.1424, 'total_message_burst_duration':r6.48097, 'total_message_count':i6341, 'total_message_throughput_rate':r119.383}
2010-02-09T04:48:57Z INFO: log: LLLOGMESSAGE (2) logMessageBurstStats {'avg_message_burst_throughput_rate':r1097.77, 'data_points':i115, 'frame_time_dur':r10.1428, 'max_message_break_duration':r2.9249, 'max_message_burst_count':i216, 'max_message_burst_duration':r0.314165, 'max_message_burst_throughput_rate':r3458.5, 'min_message_burst_throughput_rate':r438.102, 'mode':'worker', 'total_message_break_duration':r9.07722, 'total_message_burst_duration':r1.16166, 'total_message_count':i1082, 'total_message_throughput_rate':r106.676}
Homework
- I've only looked at the dataserver. What would the viewer message system output look like?
- What is the highest message latency that you've seen?
- What in-world experience corresponds to what burst statistics?


