Uploads by Oskar Linden
Jump to navigation
Jump to search
This special page shows all uploaded files.
| Date | Name | Thumbnail | Size | Description | Versions |
|---|---|---|---|---|---|
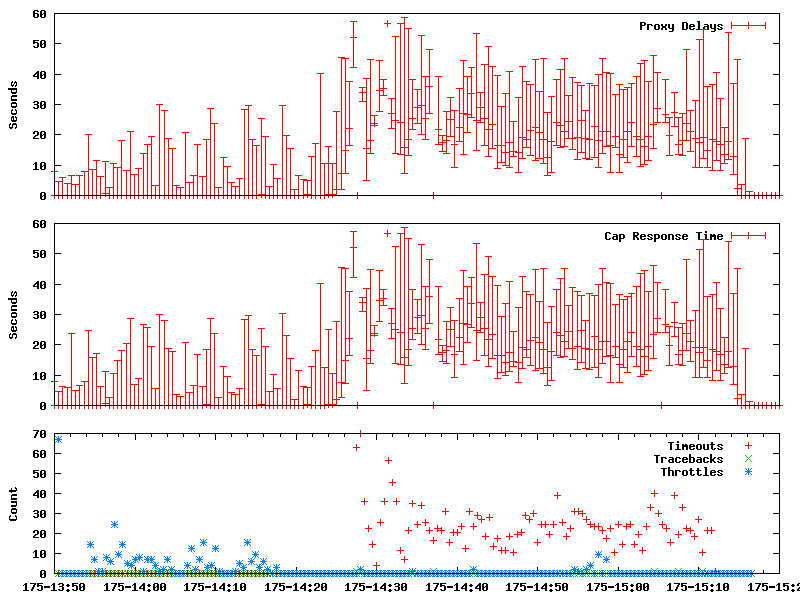
| 14:44, 7 July 2011 | SVC-6760 event.png (file) |  |
12 KB | 1 | |
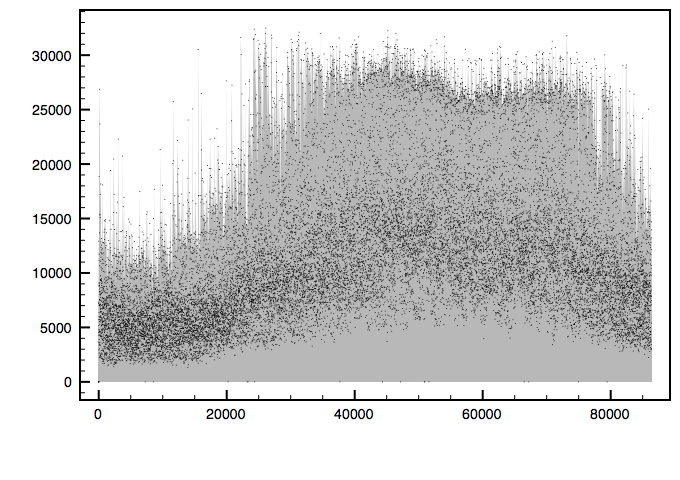
| 14:58, 16 June 2011 | Message rate.png (file) |  |
186 KB | Plot of chat messages (messages + group status updates) per minute sampled over one day. Each dot is one of the 16 util nodes | 1 |
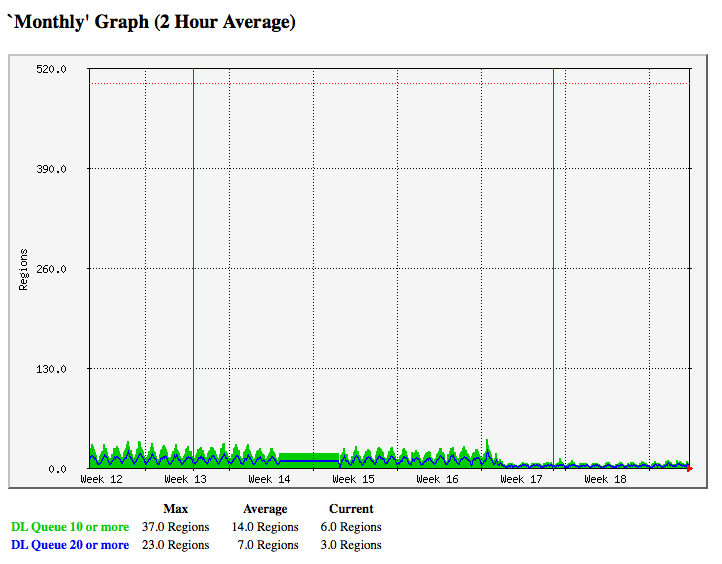
| 14:53, 12 May 2011 | FATS graph.png (file) |  |
45 KB | Analysis of download queues before and after updating the simulators with the FATS code. The plot shows the number of regions experiencing longish (>10, >20) download queues over a sample period. FATS deployed in week 17 and dropped the numbers significa | 1 |
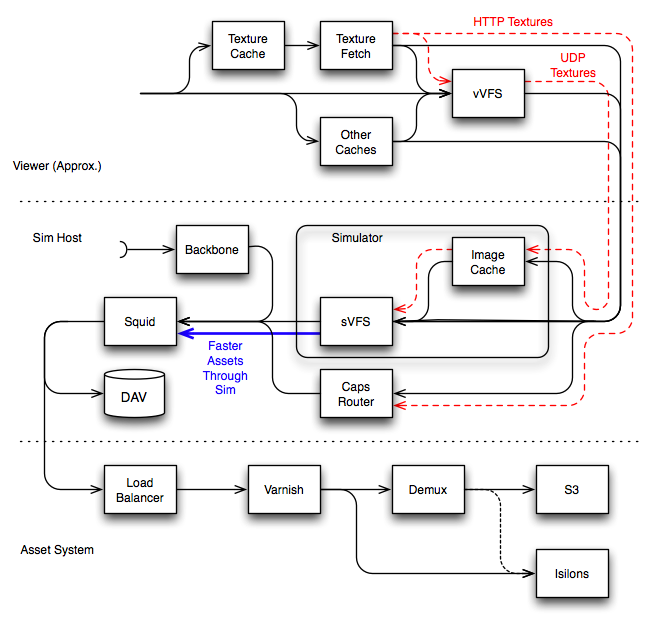
| 15:45, 10 March 2011 | Asset Paths and Caching.png (file) |  |
76 KB | Asset paths and caching | 1 |
| 16:55, 17 February 2011 | Server release status whiteboard.jpg (file) |  |
76 KB | Oskars Server Release Status Whiteboard | 1 |
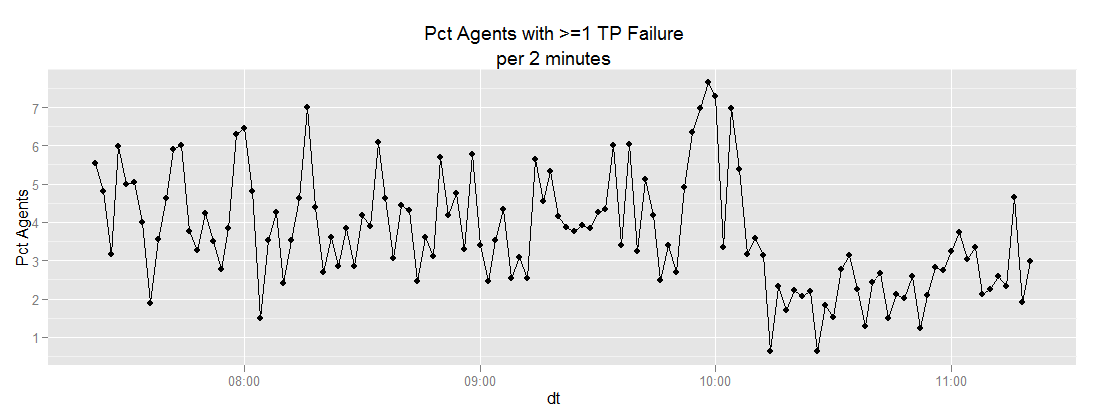
| 19:04, 13 January 2011 | Teleport failure pct compression magnum outbound 2011 01 06.png (file) |  |
11 KB | Graph showing percentage of agents with 1 or more TP failures per 2 minutes. | 1 |
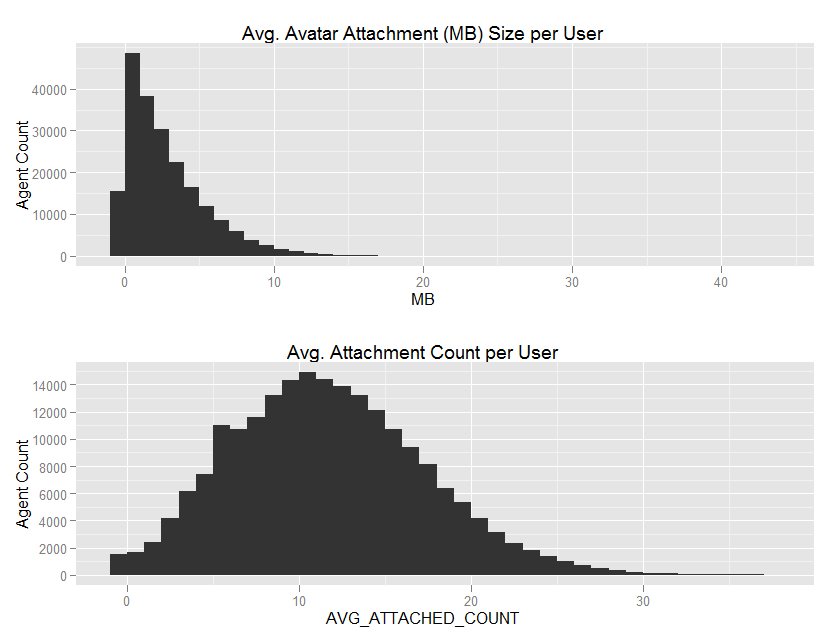
| 19:01, 13 January 2011 | Attachment distribution 2010 10 20.png (file) |  |
10 KB | Graph showing average attachment size in MB per user and average attachment count per user. | 1 |
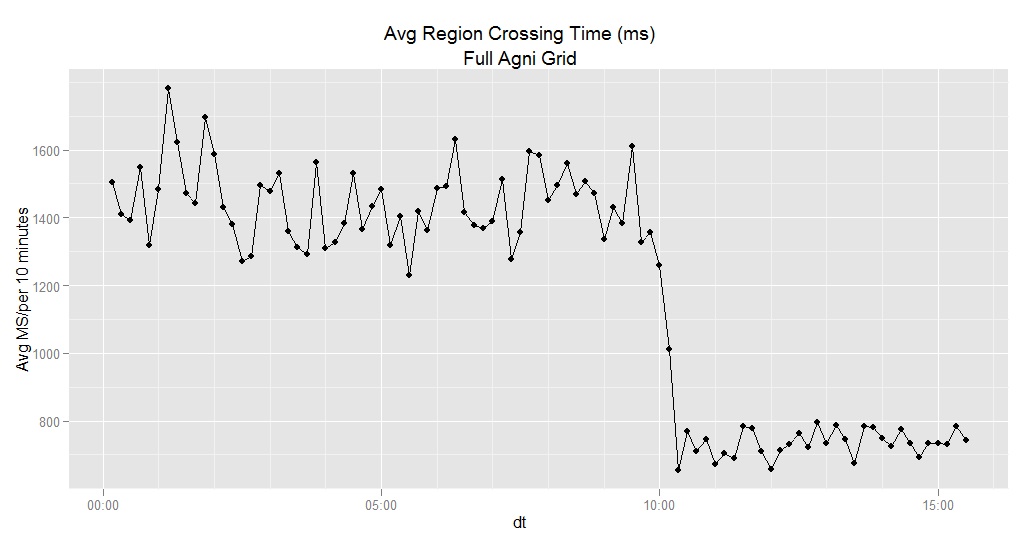
| 12:20, 13 January 2011 | Region crossing compression all agni 2011 01 10.jpg (file) |  |
78 KB | Shows average region crossing times in ms on the full grid after enabling compression. | 1 |