Difference between revisions of "Debug Help"
Alexa Linden (talk | contribs) |
|||
| (32 intermediate revisions by 12 users not shown) | |||
| Line 1: | Line 1: | ||
{{Help|BugFixes=*}} | |||
This page's purpose is to make it easier for you to provide us with info to help fix bugs. You may be asked for the following details by a Linden so we can help you further, so bookmark this for future reference. | This page's purpose is to make it easier for you to provide us with info to help fix bugs. You may be asked for the following details by a Linden so we can help you further, so bookmark this for future reference. | ||
== How do I send crash logs? == | == How do I send crash logs? == | ||
This | This is done automatically in current viewers. | ||
Note that when the Crash Reporter is active, it may go slowly as it sends us your info. This is normal. | Note that when the Crash Reporter is active, it may go slowly as it sends us your info. This is normal. | ||
== How do I find my system information? == | == [[System_info|How do I find my system information?]] == | ||
This info | |||
== Where do I find my SecondLife.log file? == | |||
<font color=red>'''IMPORTANT:''' This log contains your computer's system info and some local directory paths. It does ''not'' contain any personal/private account data, but if you feel uncomfortable providing the aforementioned publicly on the Issue Tracker, say so in the corresponding issue's comments in order to facilitate a Linden receiving it privately.</font> | |||
===Windows Vista, Windows 7, Windows 8, and Windows 10=== | |||
The log file is usually in a directory like this: | |||
C:\Users\[YOUR USERNAME]\AppData\Roaming\SecondLife\logs | |||
NOTE: [YOUR USERNAME] refers to the one used to identify you on your computer, not your Second Life Resident name. | |||
Your drive letter may vary depending on your setup, but C: is the most common. | |||
To get there: | |||
* ''Windows Vista:'' Click the taskbar's Start button > Run, then next to "Open:" type '''%appdata%''' and click OK. | |||
* ''Windows 7:'' Click the taskbar's Start button > All Programs > Accessories > Run, then next to "Open:" type '''%appdata%''' and click OK. | |||
* ''Windows 8:'' Tap the taskbar's Start button (or the Windows key), type '''%appdata%''', then press {{K|Enter}}. | |||
Scroll down and look for the "SecondLife" folder, then inside that, open the "logs" folder. | |||
===Mac OS=== | |||
: | The log file will usually be in a directory like this: | ||
/Users/[YOUR USERNAME]/Library/Application Support/SecondLife/logs | |||
{{KBtip|Can't find your Library folder on OS X Lion or later? While in the Finder, hold down the {{K|Opt}} key, and pick '''Go>Library''' from the top menu.}} | |||
===Linux=== | |||
The log file is located in: | |||
~/.secondlife/logs/ | |||
where ~ is your home/user directory. | where ~ is your home/user directory. | ||
| Line 45: | Line 49: | ||
Fast Timers are a set of scrolling bars which separate Second Life's resource usage into colored chunks. This is very useful for identifying if a certain category is using far more computer power than it should, and helps us pinpoint problems. It may look overwhelming at first, like something out of Star Trek, but as long as you can take a good screenshot and send it to us, that's what matters. | Fast Timers are a set of scrolling bars which separate Second Life's resource usage into colored chunks. This is very useful for identifying if a certain category is using far more computer power than it should, and helps us pinpoint problems. It may look overwhelming at first, like something out of Star Trek, but as long as you can take a good screenshot and send it to us, that's what matters. | ||
First, you'll need the | First, you'll need the [[Develop menu]] on. Press: | ||
* | * {{K|Ctrl|Alt|Q}} on Windows and Linux. | ||
* | * {{K|Ctrl|Opt|Q}} on Mac. | ||
You should see it appear in the menu bar, to the right of the Help menu. | You should see it appear in the menu bar, to the right of the Help menu. | ||
Once it's open, go to | Once it's open, go to Develop menu > Consoles > Fast Timers. Like this: | ||
[[Image: | [[Image:Develop-Consoles-Fast-Timers.png|256px|none]] | ||
You should see the bars appear, with an animated line graph below. | You should see the bars appear, with an animated line graph below. | ||
[[Image:Fast_Timers.jpg| | [[Image:Fast_Timers.jpg|256px|none]] | ||
Each bar corresponds to a frame, so if your performance is slow, the bars will animate slowly too. (You can try going to a busy area with many avatars and compare that to being in a quiet place with no one else around.) | Each bar corresponds to a frame, so if your performance is slow, the bars will animate slowly too. (You can try going to a busy area with many avatars and compare that to being in a quiet place with no one else around.) | ||
Feeling dizzy? Click on or near the bars to freeze the chart. Then, you can do the next step, which is to take a screen capture. There are a number of ways to do this: | Feeling dizzy? Click on or near the bars to freeze the chart. | ||
You can click on labels to expand/contract them and show a more detailed breakdown, which Lindens may ask you to do depending on the situation. For example, if you click twice on "Render" — once to hide, once to open — it goes from this: | |||
[[Image:Fast_Timers_-_Render_-_closed.png|256px|none]] | |||
to this: | |||
[[Image:Fast_Timers_-_Render_-_open.png|256px|none]] | |||
This shows a breakdown of what's using the most "Render" time, which is helpful in diagnosing graphics-related slowdowns. | |||
Then, you can do the next step, which is to take a screen capture. There are a number of ways to do this: | |||
=== Using Second Life's built-in tools === | === Using Second Life's built-in tools === | ||
* Click Snapshot button on the toolbar. | * Click Snapshot button on the toolbar, or pick '''World>Snapshot''' from the menu. | ||
* Click "Save | * Click "Save to My Computer". | ||
* Check " | * Click the '''>>''' button to reveal Advanced Options. | ||
* | * Check "Interface" in the Capture section. | ||
* You should see a little preview which shows the your screen shot. Click the round arrow button so that the fast timer bars show. | |||
* Click Save button. The first time you do this during a session, it'll ask you where you want to save the picture. Go ahead and save it somewhere you'll remember. | * Click Save button. The first time you do this during a session, it'll ask you where you want to save the picture. Go ahead and save it somewhere you'll remember. | ||
| Line 81: | Line 98: | ||
No matter what method you use, the important thing is making sure the whole Fast Timers are clearly visible. | No matter what method you use, the important thing is making sure the whole Fast Timers are clearly visible. | ||
Next, if you saved the file as a BMP | Next, if you saved the file as a BMP or another large filetype, you'll want to compress the image into a web-friendly format to get a good balance of detail and filesize. This can generally be done like this: | ||
* Open the file in the image editor. | * Open the file in the image editor. | ||
| Line 87: | Line 104: | ||
* Select "JPG" as format. You may may see an additional option to choose quality — preferably, the compressed image should be less than 500 KB, so aim for about 50-75% quality. | * Select "JPG" as format. You may may see an additional option to choose quality — preferably, the compressed image should be less than 500 KB, so aim for about 50-75% quality. | ||
If you're not sure what to use, try | If you're not sure what to use, try [http://en.wikipedia.org/wiki/Paint_(software) Paint] on Windows or [http://en.wikipedia.org/wiki/Preview_(software) Preview] on Mac. On very old versions of Windows or with very old viewers, [http://www.xnview.com/ XnView] may work out better than Paint. | ||
=== Attaching the screenshot to an issue === | === Attaching the screenshot to an issue === | ||
See the [[Bug Tracker]] to file a new issue, there will be a spot to add attachments on the form. | |||
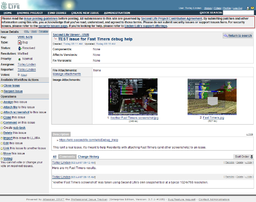
You can also attach images to an existing issue. If they're in a web-friendly format like JPG, there'll also be thumbnail previews for convenience. [https://jira.secondlife.com/browse/VWR-1478 See an example.] | |||
[[Image:VWR-1478.png| | [[Image:VWR-1478.png|256px|none]] | ||
All you have to do is: | All you have to do is: | ||
| Line 115: | Line 134: | ||
We've also got a more comprehensive and technical explanation of Fast Timers. [[Fast_Timers|Learn more]]. | We've also got a more comprehensive and technical explanation of Fast Timers. [[Fast_Timers|Learn more]]. | ||
[[Category:Tutorials]] | [[Category:Tutorials]] [[Category:Quality Assurance]] | ||
Latest revision as of 15:18, 6 December 2021
| Help Portal: |
Avatar | Bug Fixes | Communication | Community | Glossary | Land & Sim | Multimedia | Navigation | Object | Video Tutorials | Viewer | Wiki | Misc |
This page's purpose is to make it easier for you to provide us with info to help fix bugs. You may be asked for the following details by a Linden so we can help you further, so bookmark this for future reference.
How do I send crash logs?
This is done automatically in current viewers.
Note that when the Crash Reporter is active, it may go slowly as it sends us your info. This is normal.
How do I find my system information?
Where do I find my SecondLife.log file?
IMPORTANT: This log contains your computer's system info and some local directory paths. It does not contain any personal/private account data, but if you feel uncomfortable providing the aforementioned publicly on the Issue Tracker, say so in the corresponding issue's comments in order to facilitate a Linden receiving it privately.
Windows Vista, Windows 7, Windows 8, and Windows 10
The log file is usually in a directory like this:
C:\Users\[YOUR USERNAME]\AppData\Roaming\SecondLife\logs
NOTE: [YOUR USERNAME] refers to the one used to identify you on your computer, not your Second Life Resident name.
Your drive letter may vary depending on your setup, but C: is the most common.
To get there:
- Windows Vista: Click the taskbar's Start button > Run, then next to "Open:" type %appdata% and click OK.
- Windows 7: Click the taskbar's Start button > All Programs > Accessories > Run, then next to "Open:" type %appdata% and click OK.
- Windows 8: Tap the taskbar's Start button (or the Windows key), type %appdata%, then press Enter ↵.
Scroll down and look for the "SecondLife" folder, then inside that, open the "logs" folder.
Mac OS
The log file will usually be in a directory like this:
/Users/[YOUR USERNAME]/Library/Application Support/SecondLife/logs
| Tip: Can't find your Library folder on OS X Lion or later? While in the Finder, hold down the Opt ⌥ key, and pick Go>Library from the top menu. |
Linux
The log file is located in:
~/.secondlife/logs/
where ~ is your home/user directory.
How do I get my Fast Timers results?
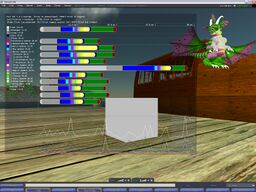
Fast Timers are a set of scrolling bars which separate Second Life's resource usage into colored chunks. This is very useful for identifying if a certain category is using far more computer power than it should, and helps us pinpoint problems. It may look overwhelming at first, like something out of Star Trek, but as long as you can take a good screenshot and send it to us, that's what matters.
First, you'll need the Develop menu on. Press:
- Ctrl+Alt+Q on Windows and Linux.
- Ctrl+Opt ⌥+Q on Mac.
You should see it appear in the menu bar, to the right of the Help menu.
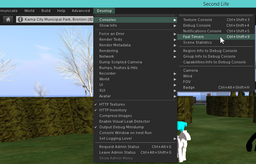
Once it's open, go to Develop menu > Consoles > Fast Timers. Like this:
You should see the bars appear, with an animated line graph below.
Each bar corresponds to a frame, so if your performance is slow, the bars will animate slowly too. (You can try going to a busy area with many avatars and compare that to being in a quiet place with no one else around.)
Feeling dizzy? Click on or near the bars to freeze the chart.
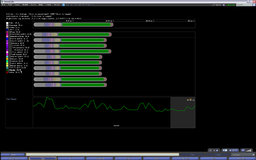
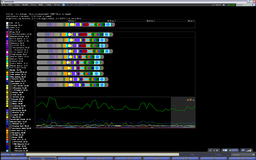
You can click on labels to expand/contract them and show a more detailed breakdown, which Lindens may ask you to do depending on the situation. For example, if you click twice on "Render" — once to hide, once to open — it goes from this:
to this:
This shows a breakdown of what's using the most "Render" time, which is helpful in diagnosing graphics-related slowdowns.
Then, you can do the next step, which is to take a screen capture. There are a number of ways to do this:
Using Second Life's built-in tools
- Click Snapshot button on the toolbar, or pick World>Snapshot from the menu.
- Click "Save to My Computer".
- Click the >> button to reveal Advanced Options.
- Check "Interface" in the Capture section.
- You should see a little preview which shows the your screen shot. Click the round arrow button so that the fast timer bars show.
- Click Save button. The first time you do this during a session, it'll ask you where you want to save the picture. Go ahead and save it somewhere you'll remember.
Using external tools
- On Windows, you can use the Print Screen key to capture and save the screen. Or, you can use a free utility like Gadwin Printscreen.
- On Mac, you can press Cmd-Shift-3.
- On Linux, there are a number of ways to do it.
No matter what method you use, the important thing is making sure the whole Fast Timers are clearly visible.
Next, if you saved the file as a BMP or another large filetype, you'll want to compress the image into a web-friendly format to get a good balance of detail and filesize. This can generally be done like this:
- Open the file in the image editor.
- Go to File menu > Save As.
- Select "JPG" as format. You may may see an additional option to choose quality — preferably, the compressed image should be less than 500 KB, so aim for about 50-75% quality.
If you're not sure what to use, try Paint on Windows or Preview on Mac. On very old versions of Windows or with very old viewers, XnView may work out better than Paint.
Attaching the screenshot to an issue
See the Bug Tracker to file a new issue, there will be a spot to add attachments on the form.
You can also attach images to an existing issue. If they're in a web-friendly format like JPG, there'll also be thumbnail previews for convenience. See an example.
All you have to do is:
- Login to the Issue Tracker (if you haven't already).
- Go to an issue (issues all start with "https://jira.secondlife.com/browse/" and end with the #. So for example, "https://jira.secondlife.com/browse/VWR-1478").
- On the left side, click "Attach file to this issue". A form will appear.
- Click Browse button and locate the image where you saved it.
- Enter a comment as appropriate — it could simply say, "Here are my Fast Timers results.", and click Attach button.
- Wait a few seconds, and if it succeeded, you'll end up back on the issue's main page, now showing your attached Fast Timers screenshot.
For power users
If you know what you're doing, you don't even have to save to disk: a much quicker way is to capture the screen to clipboard, then on the issue's main page, click "Attach screenshot to this issue" and click Paste button. It should appear in the preview box, then you can customize the file name, make a comment, then attach it.
Related, see JIRA maker Atlassian's documentation.
We've also got a more comprehensive and technical explanation of Fast Timers. Learn more.
