Region Performance Improvement Guide
This article explains how to check your Second Life Region's performance and the steps you can take to improve it. This wiki was written for owners of Estates, sometimes referred to as Islands, but mainland owners may find parts of it helpful.
Checking Your Region's Performance
To see the performance of your Region you'll want to check the Region's Frames Per Second (FPS). To do this you can use the Statistics Bar. While standing on your land select the View Menu > View Statistics Bar. This can be a bit overwhelming so we'll guide you through it. Note, Sim stands for Simulator and is another name for Region. In the Picture below we've circled the "Sim FPS", which is your Region's Frames Per Second.
To interpret the Sim FPS performance of your Region:
- 45 FPS: The best. No action necessary.
- 35 - 44 FPS: This is good quite good and you don't need to tune if it never goes below 35 FPS.
- 20 - 35 FPS: This is slow and should be noticeable. Adjustment is needed to improve your Region's performance.
- 10 - 20 FPS: This is bad and quite serious.
- 0 - 10 FPS: This is terrible. Time to open a Support Ticket.
If your performance of your Region is consistently over 35 FPS at its busiest time you can stop here. Fortunately, Regions are above 35 FPS most of the time. For example, during the month of October 2007, all the Second Life Regions were only below 35 FPS an average of less than 2% of the time.
In the screenshot above, you'll notice the Sim FPS is 21, which means the Region is very slow. The Main Agents line shows 96, which is the number of Agents (Avatars) currently in your Region. This is exceptionally high and is the prime cause of this Region's slow FPS. The Child Agent is the number of Avatars outside your Region that can see into your Region and also can slow your Region down if it is a significant number.
To see more detail on what is slowing down your Region, expand the Statistics Bar by clicking on the last line "Time (ms)" with your mouse to see the additional Region statistics shown below:
The "Total Frame Time" shows the number of milliseconds (ms) to display a single frame. Time greater than 22.2 ms means your Frame Rate will be below 45 FPS. For a detailed explanation of these see the knowledge-based article on the Statistics Bar and scroll to the section on Time. However, we'll explain these Time measurements as we walk through the ways to improve your Region's performance.
Improving Your Region's Performance
There are a number of steps that you can take to improve your Region's performance. We've listed the steps in approximate order of the biggest impact and least effort, however, each Region is unique.
Reduce the Maximum Number of Avatars in Your Estate
The number of avatars in a region is the most common cause and usually the biggest contributor to low Region FPS. This number has often been increased above the default setting, resulting in lower Region performance. Lowering the maximum number of Avatars allowed in your Estate will usually increase your Estate's FPS. This can be done by selecting the World Menu > Region / Estate Menu Item. This will bring up the Region / Estate Window where you can adjust the Agent Limit field, which is the number of avatars allowed in your Region at any one time.

The default Agent Limit setting is 40 for Regions. As an Estate owner you can adjust this setting. Your avatar can see approximately 30 other avatars. It is recommended to look at the Agent Time in the Statistics Bar to see how well your Region is performing during your busiest time. Keeping your Agent Time below 9 ms during its busiest time is recommended. For more information, you can read the knowledge-based article on how to set the number of avatars in a region.
Remove Top Scripts
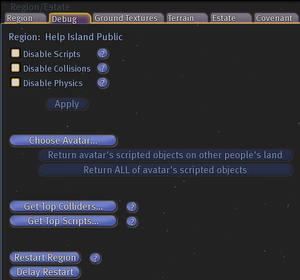
Inefficient or very busy scripts in your Region can slow it down. In the Statistics Bar, the Script Time line shows how many milliseconds each of the scripts in your Region is taking. If it is over 5 milliseconds then it may be worth investigating if this can be reduced. Too see which scripts are the busiest, in your Estate, select the Debug Tab in your Region / Estate Window as shown below.

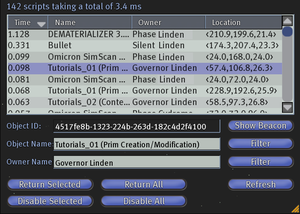
Then click on Get Top Scripts, which will bring up a Window shown below.

By clicking twice on the Time column heading it will sort the busiest scripts at the top. Hitting Refresh several times will capture different time slices and give a more accurate picture of the top scripts. Once you know which scripts are consuming your Region's resources, you can remove, replace or optimize them. Also, note that reducing the total number of scripts in your Region can improve performance.
Examples of problematic scripts include: ones that are constantly active without sleeping. For example, sensor scripts with less than a few second sleep interval. Another example is temp-rezzer scripts that allow a slightly larger number of prims at the expense of Region performance.
Remove Top Colliders
The top collider physical objects in your Region can potentially slow it down. These are physical objects that are often moving and can contribute significantly to the time your Region takes to perform the physics calculations. In the Statistics Bar the Physics Time line shows how many milliseconds your physics is taking. If it is over 4 milliseconds then it may be worth investigating if this can be reduced. Too see which colliders are the most active, select the Debug Tab in your Region / Estate Window as shown below.

Then click on Get Top Colliders, which will bring up a Window shown below.

By clicking twice on the Time column heading it will sort the most active colliders at the top. Since the top colliders list is based on a small time slice, its good to hit refresh a few times to get a more accurate picture. Once you know which objects are your top colliders, you can remove, replace or optimize them. Also note that removing the total number of moving objects in your Region can improve performance.
Remove Large Textures
Excessive use of large textures can slow down a Region. In general, its good to avoid using textures greater than 512x512 pixels. In the Statistics Bar, the Images Time line shows how many milliseconds handling your Region's images is taking. If it is over 2 milliseconds then it may be worth investigating if this can be reduced. When an avatar views a large image or numerous smaller images for the first time since entering the Region, they will automatically download the image to their Viewer. If a number of avatar's are doing this at the same time then this will put a significant load on your Region, slowing down its FPS. If you can't remove these large textures then reducing the number of unique textures, the size of the textures and/or the resolution can increase your Region's performance.
Optimize Scripted Texture-Changing Objects
Scripted objects that change textures can also slow down a Region. Each time a new texture is displayed, it must be downloaded to each Avatar who is looking at the object. If you can't remove these objects then reducing the number of unique textures and size of the textures in these objects can increase your Region's performance.
Reduce the Number of Prims Used
Reducing the number of prims your Region uses will increase your Region's performance. Regions are currently limited to 15,000 prims.
Reduce Number of Objects
Large numbers of objects, especially if they are moving, rotating, flashing, scripted or shape changing sculpties will slow your Region down.
Reduce Visitor Attachments
While this is harder to do, some Regions have been able to get a speedup by having the visitors remove attachments, especially high-prim or heavily scripted.
Region Optimizations for Improved Viewer Performance
The following Region items can slow down Viewer performance:
- Big Prims greater than 10 m x 10 m can slow down Viewer FPS.
- Large or numerous textures when an avatar first comes within sight of them
- Overuse of sculpted prims, twisted tori, and other geometrically complex objects.
- Particle effects (which includes bling and poofers).
Keep in mind some of your visitors may have slow graphics cards or PCs.
Upgrade to a Faster Region
There are different classes of Regions with different levels of performance. The newest class of Regions is class 5 and was introduced in November of 2006 as described in Ian's blog post. All Regions added since November 2006 have been class 5. Class 5 Regions (Sims) can handle significantly more simultaneous avatars, more scripts, more physics, more objects and more textures at one time then class 3. For class 3 Estate owners you can upgrade to class 5. The class is specified when we deliver it to you.
More Info
You can do numerous other Estate management tasks using the Region/Estate Window as described in the linked knowledge-based article.
Conclusion
Despite the fact Regions on average Regions are only below 35 FPS a few percent of the time, we understand that slow Region performance can be aggravating to say the least. For those Regions and Estate owners, we've described how to achieve good performance by using the Statistics Bar during your busiest times and then adjusting the number of avatars, scripts, textures, objects and moving physical objects in your Region. We hope this article helps you find the right balance between making your Region cool and fast.