Improving Region Performance
This article explains how to check your Second Life region's performance and some steps you can take to improve it. This article has been written with owners of Estates (sometimes referred to as islands) in mind, but mainland owners may find parts of it helpful.
Checking Your Region's Performance
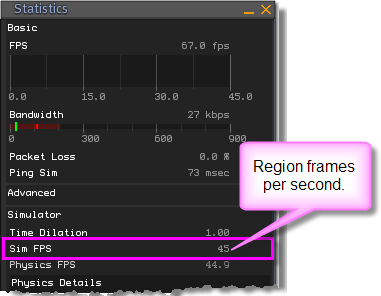
To see the performance of your region you'll want to check the region's Frames Per Second (FPS). To do this you can use the Statistics Bar. While standing on your land, select View > Statistics Bar. This can be a bit overwhelming, so we'll guide you through the relevant parts here.
Statistics Bar with Sim FPS (a measure of your region's Frames Per Second) highlighted.
| Note: Sim stands for "simulator" and, for the purposes of this article, is another name for "region." |
To interpret the Sim FPS performance of your region:
- 45 FPS: The highest possible value. No action necessary.
- 35 - 44 FPS: This is good performance; you don't need to tune if it never goes below 35 FPS.
- 10 - 35 FPS: This is very slow, and should be noticeable. Adjustment is needed to improve your region's performance.
- 0 - 10 FPS: This is terrible. You may have trouble moving or performing simple tasks. See above.
If your performance of your region is consistently over 35 FPS at its busiest time, you can stop reading here. Fortunately, most regions are above 35 FPS most of the time. For example, during the month of October 2007, all the Second Life regions were below 35 FPS an average of less than 2% of the time.
In the screenshot above, you'll notice the Sim FPS is 21, which means the region is very slow. The Main Agents line shows 96, which is the number of agents (avatars) currently in your region. This is exceptionally high, and is likely the prime cause of this region's slow FPS. The Child Agents line displays the number of avatars outside your region that can see into it, which can also slow your region down if it's a significant number.
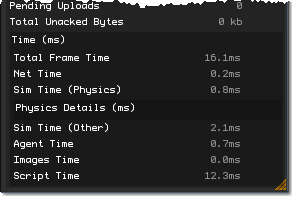
To see more detail on what's slowing down your region, expand the Statistics Bar by clicking on the Time (ms) line; additional region statistics will appear:
The Total Frame Time displays the number of milliseconds needed (ms) to display a single frame. Total Frame Time greater than 22.2 ms means your Sim FPS will be below 45 FPS. For a detailed explanation of the values beneath Total Frame Time, see the Statistics Bar article's Time section. However, we'll explain some of these measurements below as we walk through the ways to improve your region's performance.
Improving Your Region's Performance
There are a number of steps that you can take to improve your region's performance. We've listed the steps in approximate order of the biggest impact and least effort. It's worth noting, however, that each region is unique.
Reduce the Maximum Number of Avatars in Your Estate
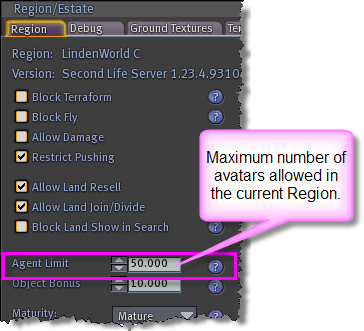
The number of avatars in a region is the most common cause and usually the biggest contributor to low region FPS. This number has often been increased above the default setting of 40, resulting in lower region performance. Lowering the number of avatars in your region can usually increase your region's FPS. This can be done in the Region tab of the Region/Estate window (World > Region/Estate); adjust the Agent Limit field to specify the number of avatars allowed in your region at any one time.
The default Agent Limit setting is 40. As an estate owner, you can adjust this setting. We recommend looking at the Agent Time in the Statistics Bar to see how well your region is performing during your busiest time. Keeping your Agent Time below 9ms during its busiest time is a good idea.
Remove Top Scripts
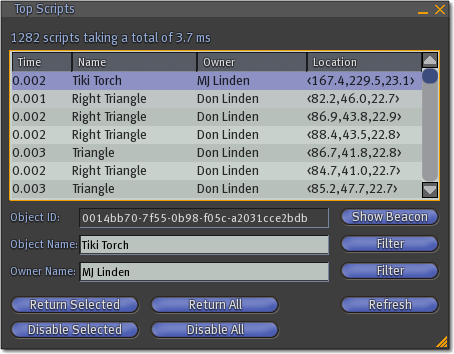
Inefficient or very busy scripts in your region can slow it down. In the Statistics Bar, the Script Time line shows how many milliseconds each of the scripts in your region is taking to run. If this value is over 5 milliseconds, then it may be worth checking to see if it can be reduced. To see which scripts are the busiest in your region, open the Debug tab in your Region/Estate window and click Get Top Scripts, which will open the Top Scripts window.
- Clicking twice on the Time column heading sorts the busiest scripts at the top.
- Since this list is based on a small slice of time, it's a good idea to click Refresh a few times to get a more accurate picture.
- Selecting a line and clicking Show Beacon activates a beacon inworld highlighting the object running the selected script.
Once you know which scripts are consuming your region's resources, you can remove, replace or optimize them. Also, note that reducing the total number of scripts in your region can improve performance.
Examples of problematic scripts include:
- Scripts that are constantly active without sleeping; for example: Sensor scripts with less than a few-second sleep interval.
- Temp-rezzer scripts that allow a slightly larger number of prims at the expense of region performance.
Remove Top Colliders
Physical objects can potentially slow your region down. Specifically, physical objects that are often moving and collide with each other can contribute significantly to the time your region takes to perform the physics calculations. In the Statistics Bar, the Sim Time (Physics) line shows how many milliseconds your physics calculations are taking. If this value is over 4 milliseconds, then it may be worth check to see if this can be reduced. To see which colliders are the most active, open the Debug tab in your Region/Estate window and click Get Top Colliders, which will open the Top Colliders window.
- Clicking twice on the Time column heading sorts the most active colliders at the top.
- Since the top colliders list is based on a small time slice, it's a good idea to click Refresh a few times to get a more accurate picture.
- Selecting a line and clicking Show Beacon will activate a beacon inworld highlighting the selected object.
Once you know which objects are your top colliders, you can remove, replace or optimize them. Also note that lowering the total number of moving objects in your region can improve performance.
Reduce the Number of Prims Used
Reducing the number of prims your region uses will increase your region's performance. Regions are currently limited to 15,000 prims, but if you stay significantly below this number, your region performs noticeably better.
Reduce Number of Objects
Large numbers of objects will slow your region down, especially if they're of any of the following types:
- Moving
- Rotating
- Scripted
- Shape-changing sculpties
Reduce Visitor Attachments
While this is harder to do, some regions have seen improvement by having visitors remove attachments, especially high-prim or heavily scripted ones.
Region Optimizations for Improved Viewer Performance
The following region items can slow down viewer performance:
- Large or numerous textures, when an avatar first comes within sight of them
- Overuse of sculpted prims, twisted tori, and other geometrically complex objects.
- Particle effects (which includes bling and poofers).
Keep in mind some of your visitors may have slow graphics cards or PCs. This article discusses frame rate performance per graphics processing unit (GPU).
More Info on the Region/Estate Window
You can perform numerous other estate management tasks using the Region/Estate Window.


